Hello, you are using an old browser that's unsafe and no longer supported. Please consider updating your browser to a newer version, or downloading a modern browser.
Hello, you are using an old browser that's unsafe and no longer supported. Please consider updating your browser to a newer version, or downloading a modern browser.

Dr. Vanessa Pellington of New Brunswick Public Schools discusses new techniques used to meet students at the intersection of their academic and social-emotional progress.
To begin the 2021-22 school year, most students were met with a bevy of diagnostic tests to pinpoint their needs in English Language Arts and Math. In New Brunswick Public Schools, districts leaders knew that understanding student needs would require an approach that was bigger than academics.
“In New Brunswick, our theme this year is ‘To teach you, we must know you,'” says Dr. Vanessa Pellington, Director of Assessments, Evaluation, and Planning, who was on the committee of administrators working to improve data use across the district. “We have a very transient population, so a report we ran yesterday might look very different today. We have to be really intentional with the systems we use.”
To truly ‘know’ each student, the district sought to design an effective way to snapshot each student on-the-fly and understand a range of factors affecting their career, using both academic and social-emotional lenses.
“We have a lot of data,” says Dr. Pellington. “One thing we’ve been working on is how we get that data into the hands of our teachers, counselors, and interventionists with less steps and less roadblocks.” Dr. Pellington and the NBPS team were committed to designing an approach that actually fit inside the tight confines of a busy school day.
For NBPS, there were three factors that were essential to understand each student’s story: timely data that is holistic, accessible to all staff, and radically efficient.
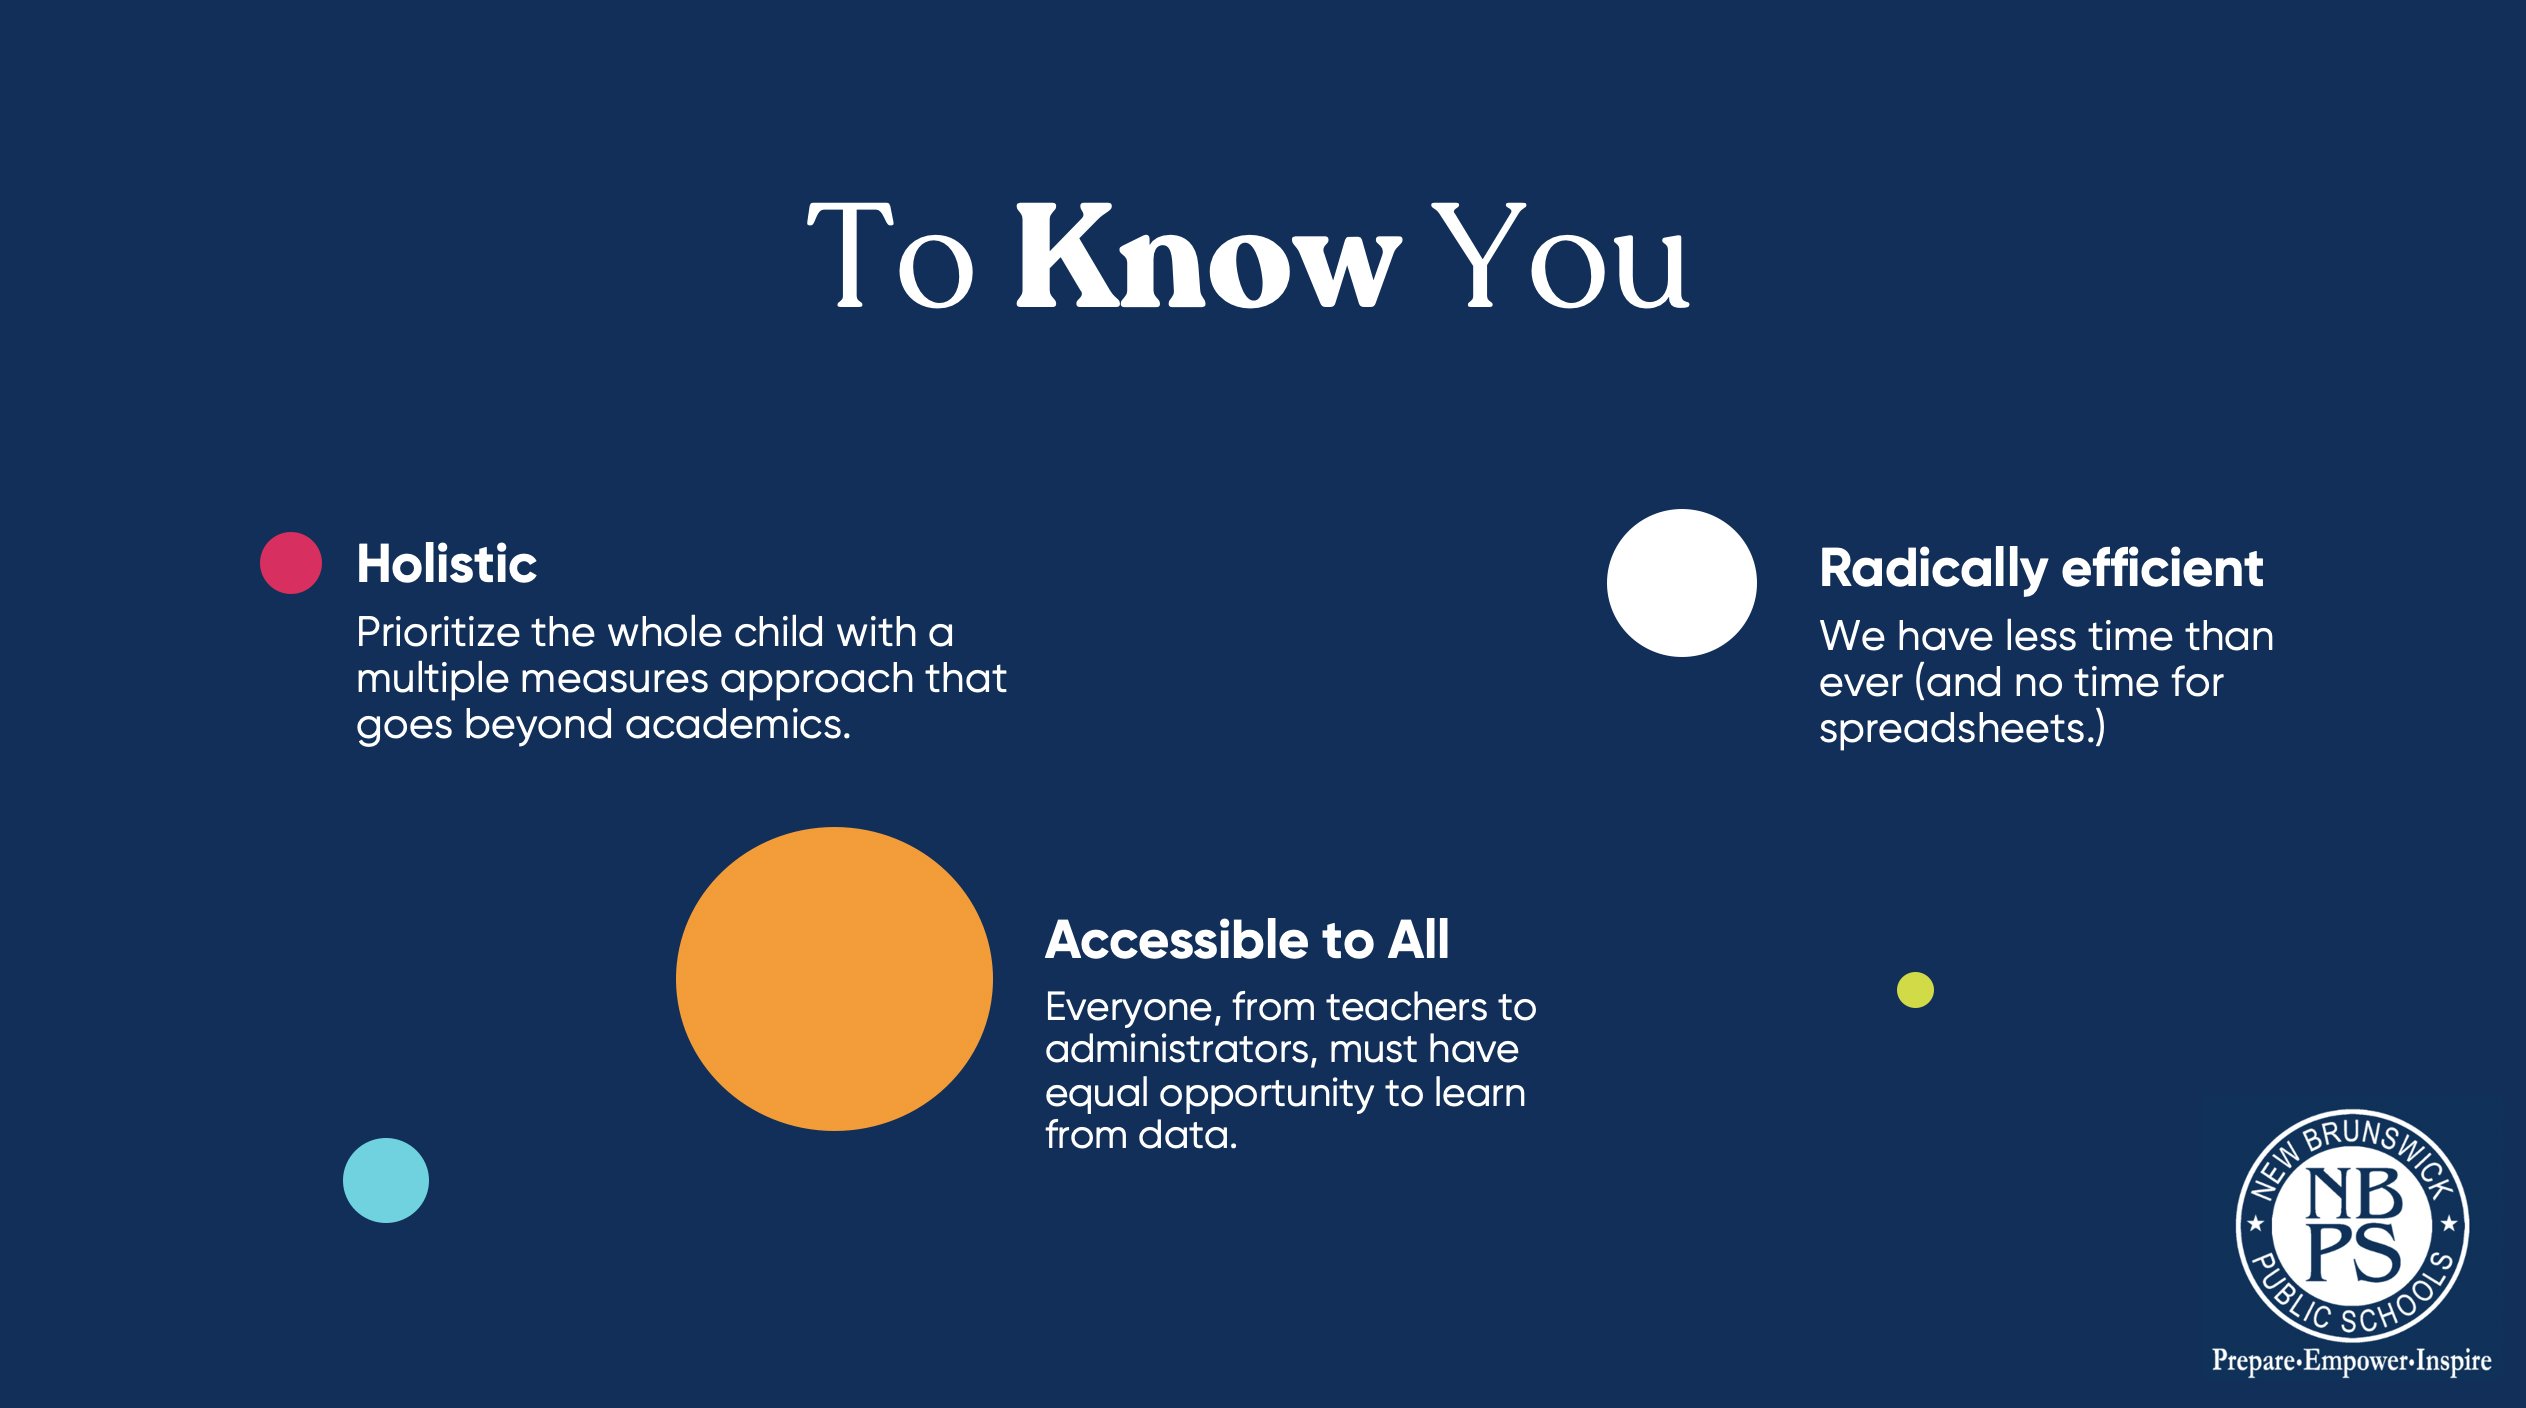
NBPS sought what was long considered a “unicorn” in education: a single source of truth for items like state assessments, grades, academic interventions, as well as social-emotional data points that could be both a) readily accessible, but also b) highly secure.
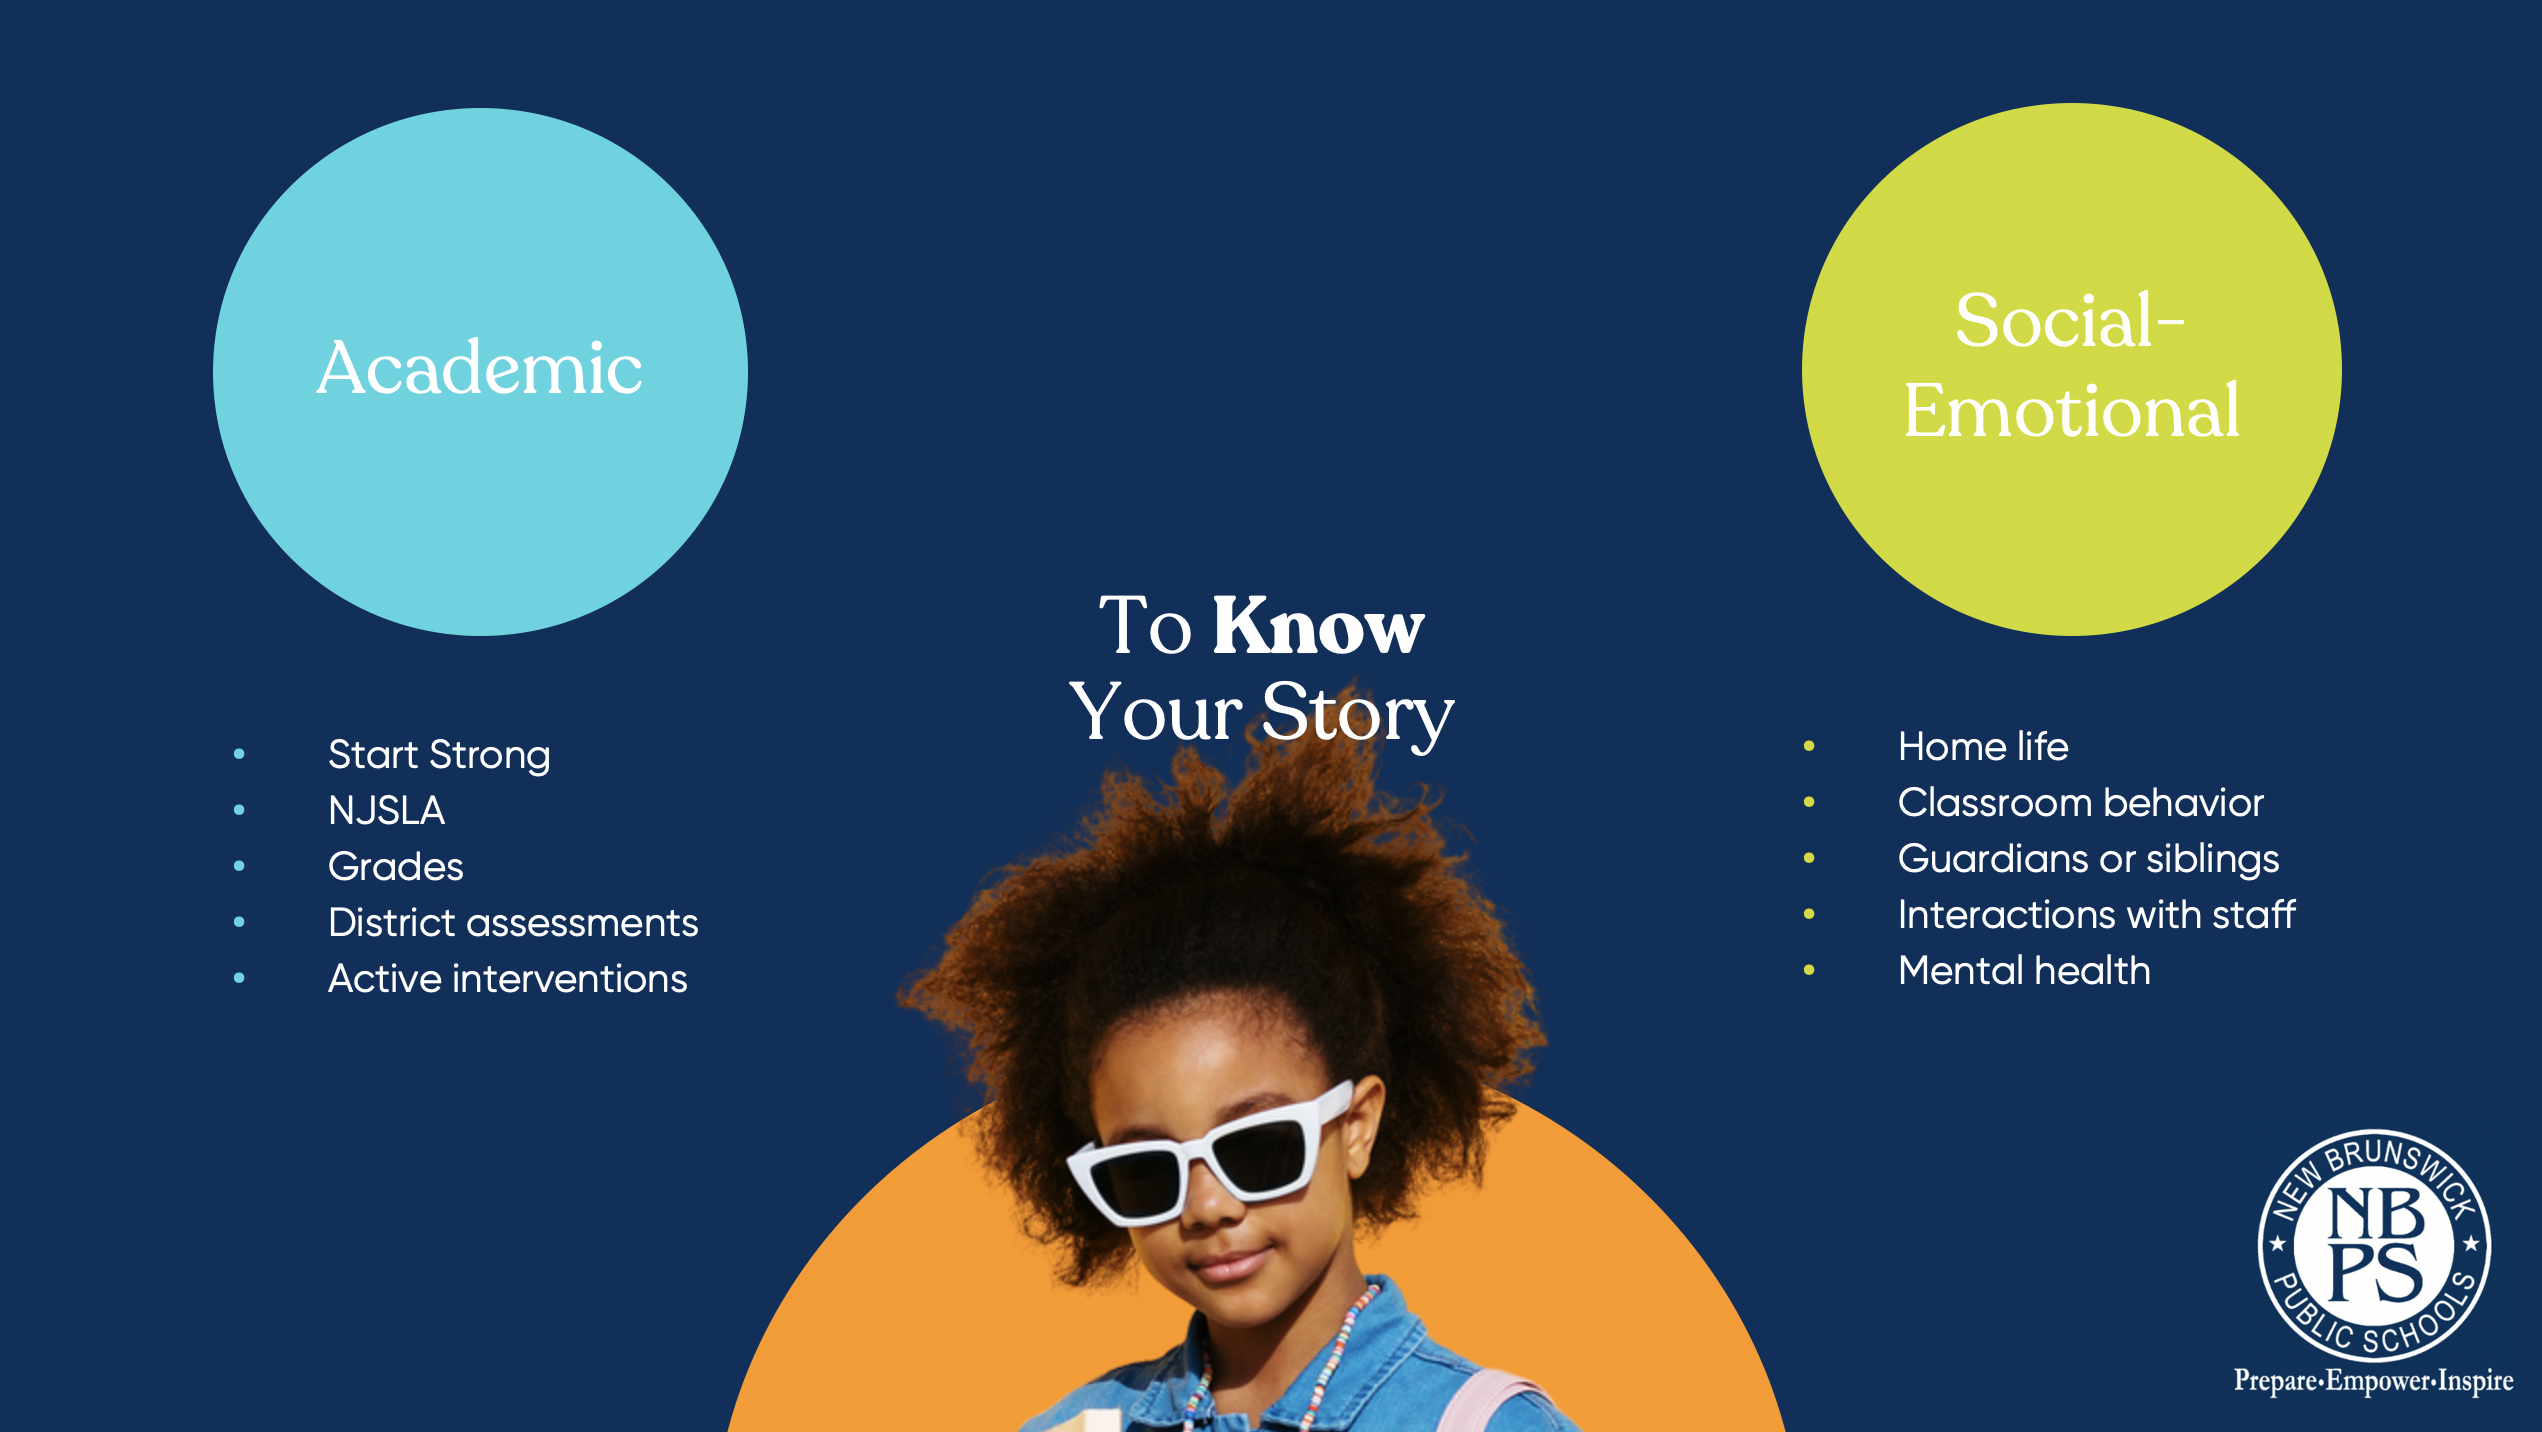
Leaders at New Brunswick approached NJ ed-tech provider OnCourse Systems for Education with a vision for a “single pane of glass” that could, swiftly and securely, integrate a wide range of student information, including:
Together, the district and OnCourse created two new technology tools to meet these needs, called Student Story and Multiple Measures.
The Student Story is a secure online dashboard that brings together more than 20 aspects of a student’s career, including all the items listed above. As the request of district leaders, each staff member can customize the Student Story to bubble up the data that is most important for them.
“It’s kind of a game changer,” said Dr. Pellington. “If I’m working with a student that I just met today and a situation that needs to be resolved immediately, I can look quickly at this and know how to navigate that conversation.”
The real game-changer, however, was that the Student Story largely updates itself. The systems draws from live activity happening across the district; meetings happening with counselors, assessments conducted in classrooms, parents interacting from their cell phones: the data transmits instantly and securely to the Student Story.
This was only possible, however, because New Brunswick Public Schools made a decision that most districts are hesitant to make: to choose a new Student Information System that was specifically geared toward student growth.
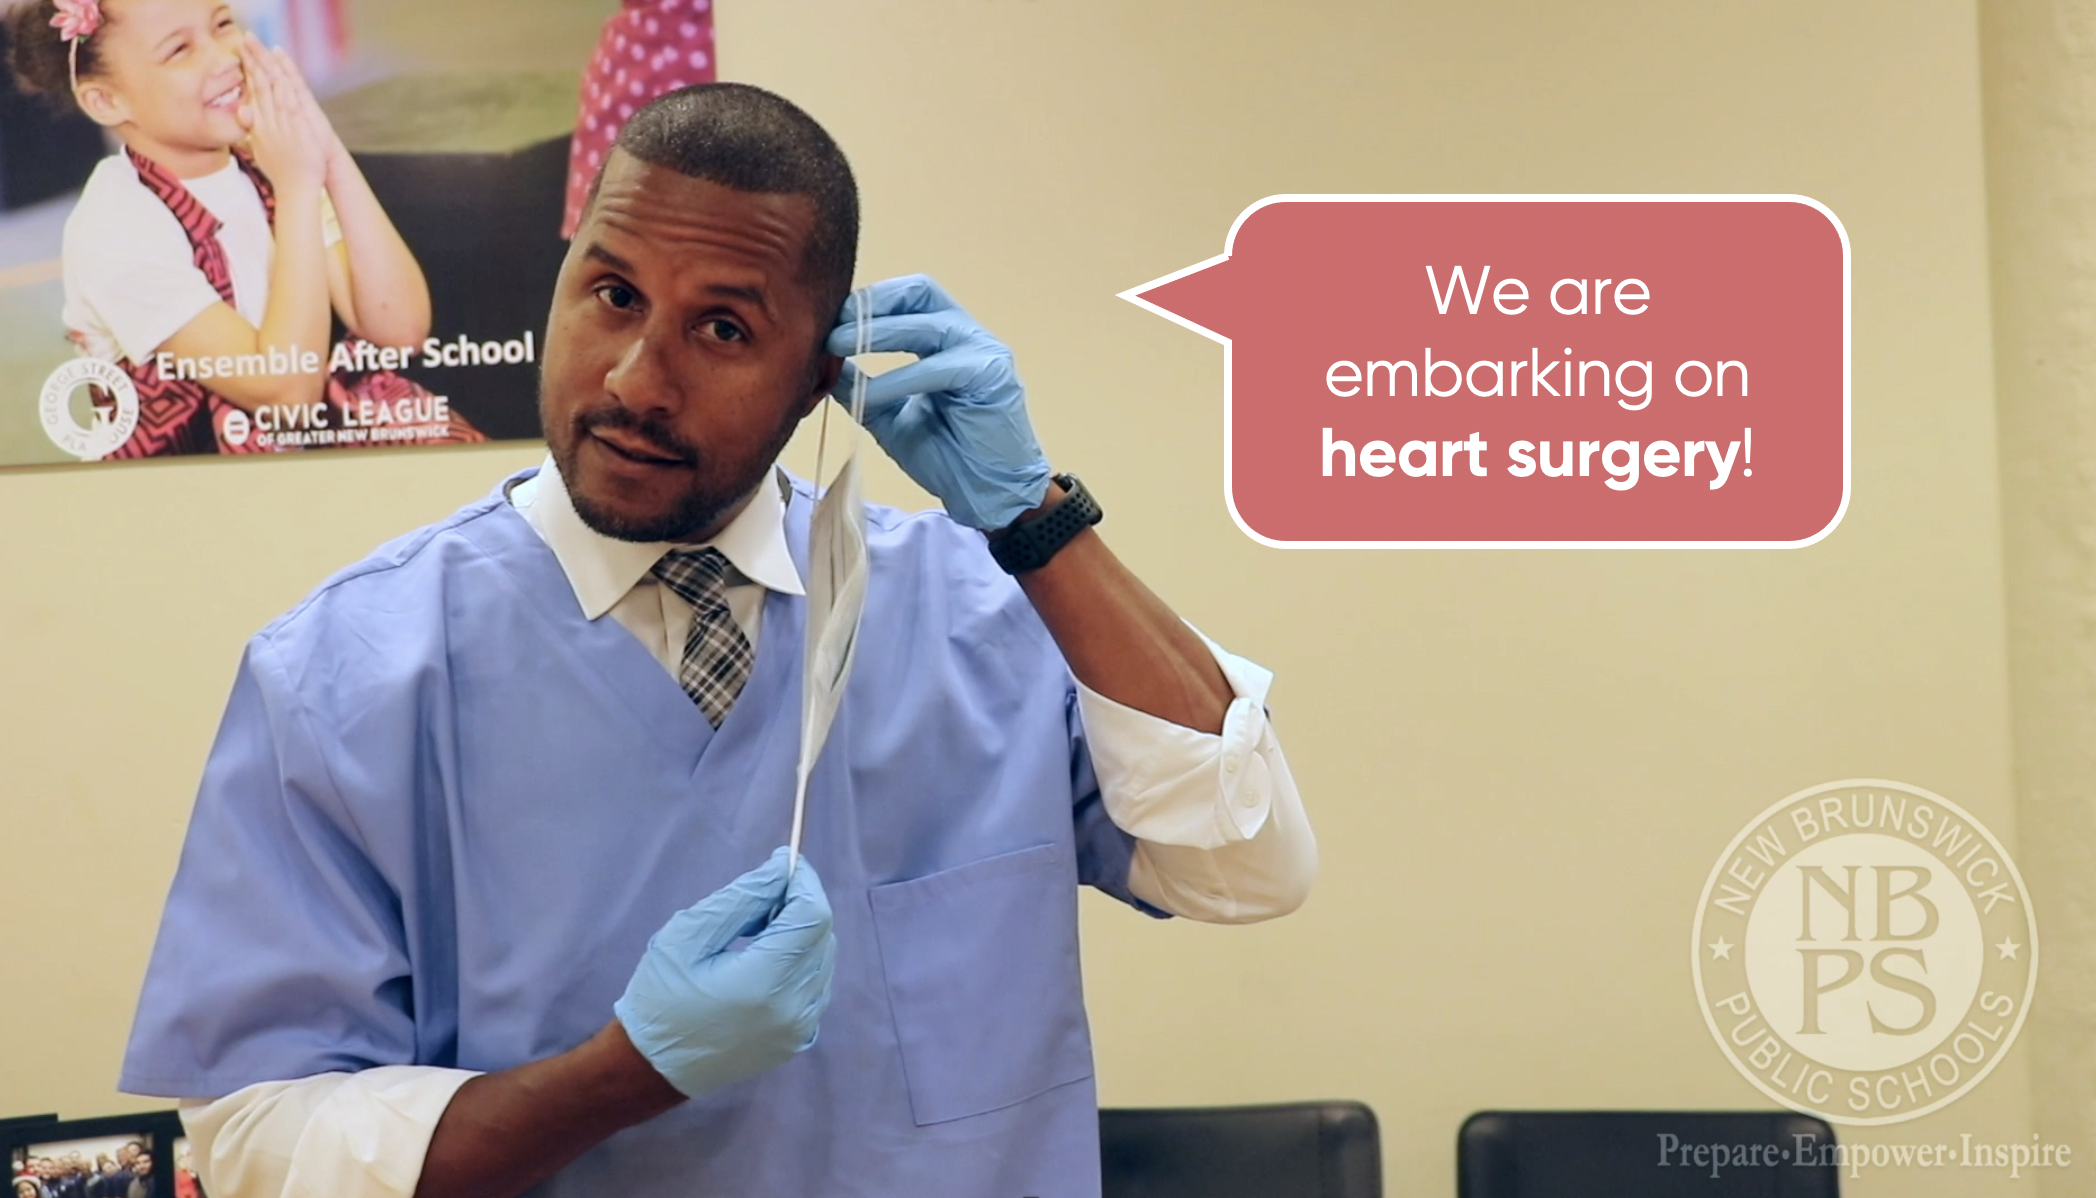
In a process that Superintendent Aubrey Johnson called “heart surgery”, the district switched away from several disparate assessment and data systems into OnCourse’s all-in-one platform that included OnCourse SIS, OnCourse Assessment, OnCourse Analytics, and more.
Integrating their data with their SIS was also crucial for data security. The OnCourse SIS acted as the gatekeeper for sensitive data, ensuring that only authorized staff members could access confidential student records.
While Student Story was an excellent fit for understanding the trajectory of any individual student, it was important for the district to never lose sight of the forest for the trees. What is the best way to tell if an interesting data point is unique to one student’s story, or if it is indicative of a larger trend?
“Our cabinet members are at the macro level and want to see the big picture,” says Dr. Pellington. “When we need to dig deeper, that is where Multiple Measures comes in.”
Multiple Measures was a project co-created by OnCourse and New Brunswick Public Schools to accomplish several goals, like:
For a brief introduction to Multiple Measures, click here.
“We use Multiple Measures to build our district programs,” said Pellington. “For example, our summer programs were focused primarily on literacy. In June, we used this tool to pull multiple pieces of data to decide where to place students and with what support. All the data we need is accessible; reading assessments, standardized assessments, everything we need to meet students where they are.”
Districts can upload data to pre-made templates for most common tests, like summative assessments, ACT/SAT, iReady, Dibels, Start Strong, Star, and MAP.
Once a district has a single source of truth that contains both academic and non-academic data, staff can suddenly answer the toughest questions in only a few clicks, like:
Using Multiple Measures, districts can combine up to 3 “factors” and explore the intersection of these data points. In the example below, the district asks an easy question.
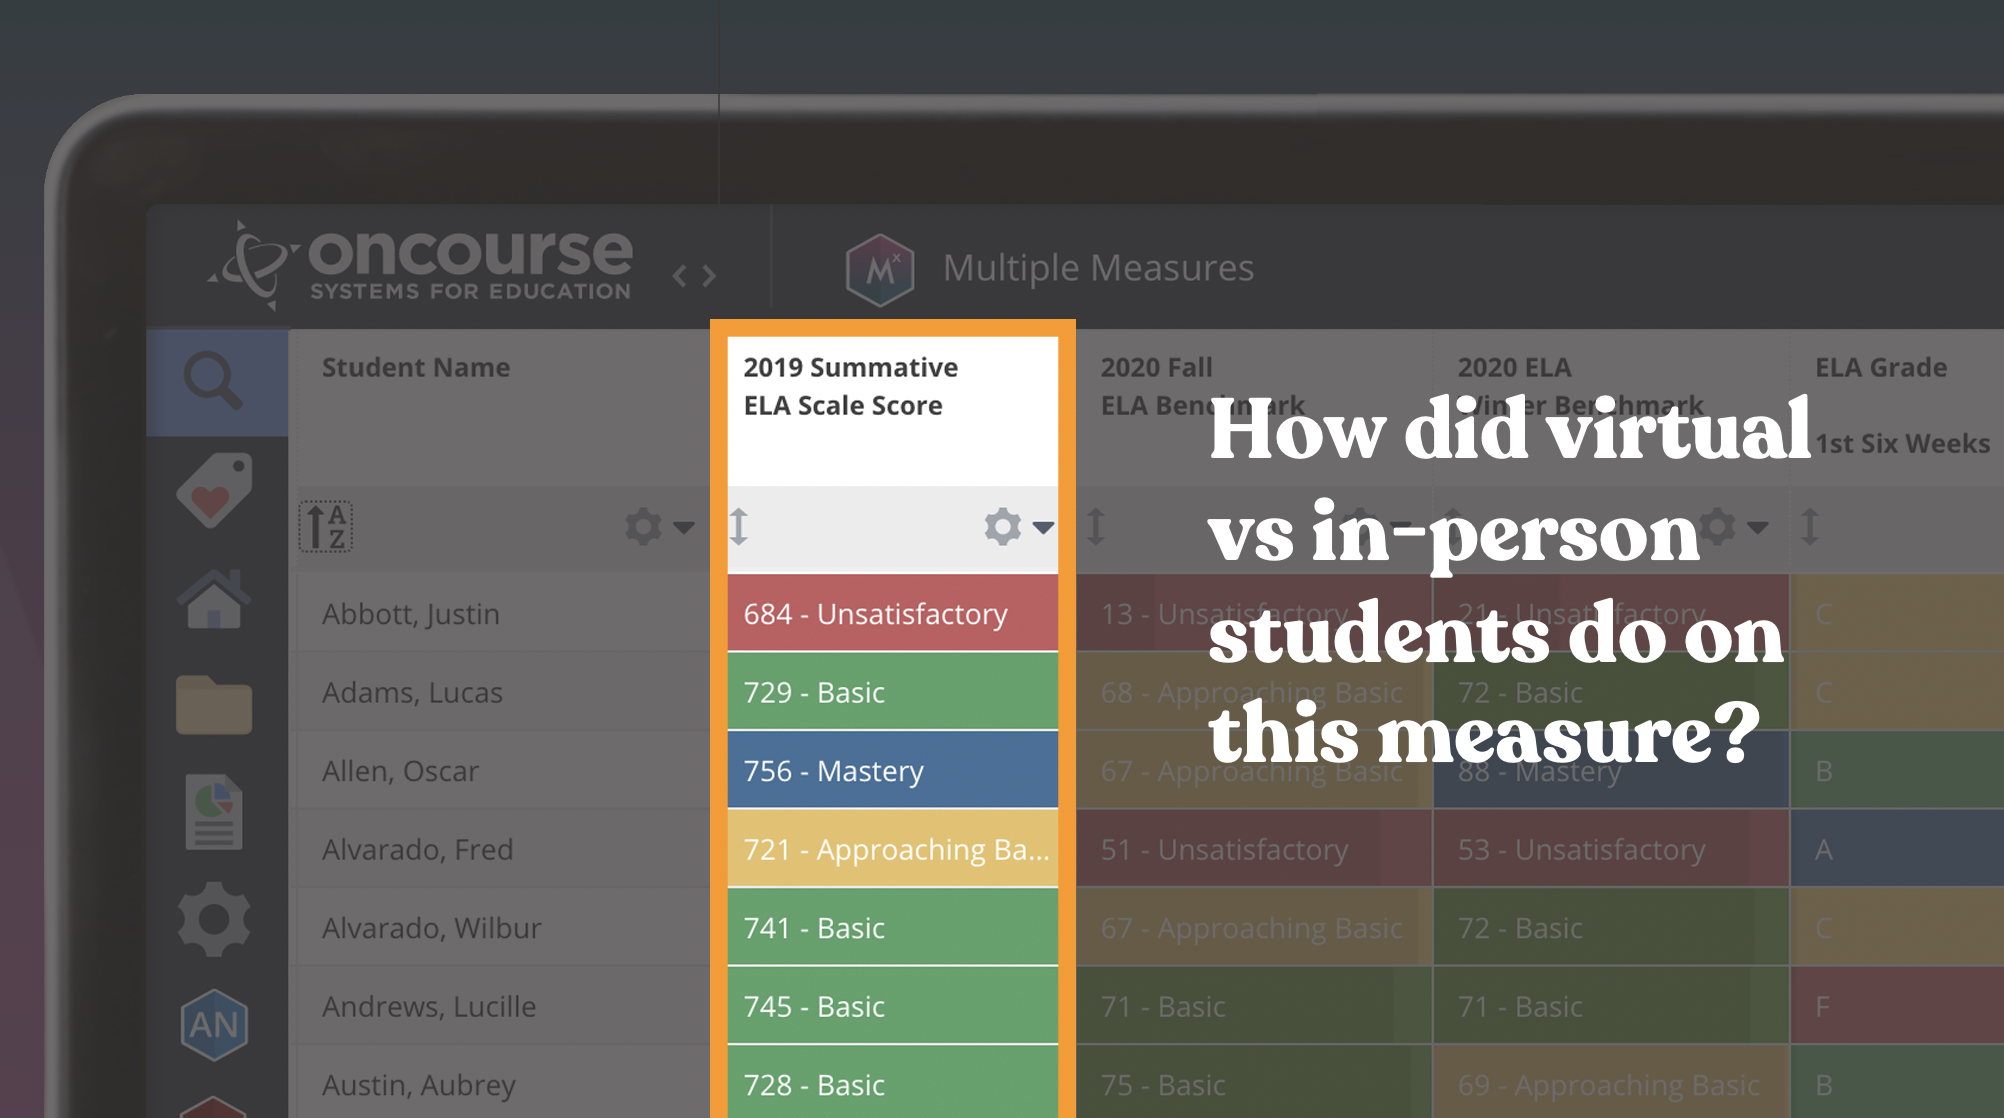
Using Multiple Measures (below), the district chooses to explore a Summative ELA test score, which OnCourse plots on a histogram, one dot per student, organized across color-coded performance bands.
The user then applies a “factor” of Cohort. The system automatically disaggregates the data by Hybrid, In-Person, and Remote students. Using easy-to-read blue lines, it is clear that In-Person students performed the best on average, followed by Remote, then Hybrid.
The system also adds an auto-generated explanation below:
To arrange a demonstration for your district, contact Melissa Torba, Education Technology Specialist, at [email protected].
After creating Student Story and Multiple Measures with districts like New Brunswick Public Schools, OnCourse released the features free for their network of schools. These tools are now being used daily by thousands of administrators, teachers, and office staff members.
“We have a different philosophy than most SIS providers,” says Chris Contini, OnCourse’s Chief Executive Officer. “Our work is not only to save districts time with state reporting, grading, and things that most SIS products do, but also to help students grow. Projects like these are part of fulfilling that mission.”
What about school districts not using the OnCourse SIS?
“Districts can purchase Multiple Measures as a standalone data warehouse, and it’ll be integrated with their current SIS,” says Contini. “However, we’ve been in education for twenty years. One in three of our staff members are educators. We know that the ‘Here’s another thing!’ approach is not a recipe for sustained success in today’s high-burnout environment.”
“We believe strongly in bringing things together,” says Contini, “and our school districts are realizing the benefits of giving their educators a single place to go for everything they need.”